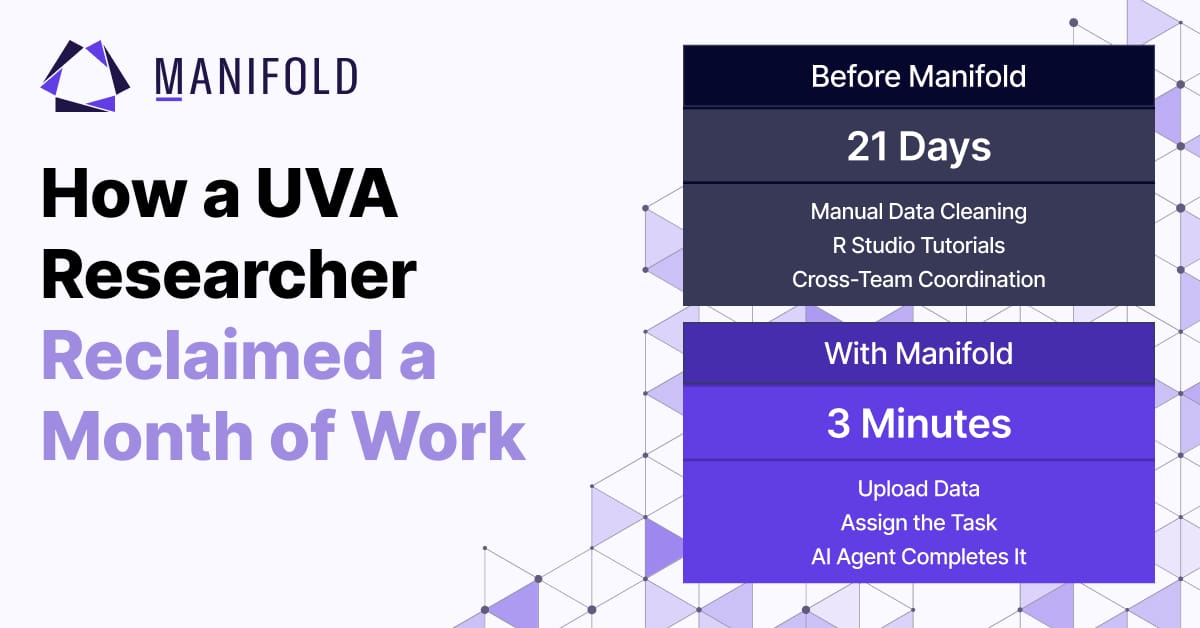
From 21 Days to 3 Minutes: How I Reclaimed a Month of Work

Every year, I send a newsletter to the patients who have consented to our biobanking protocol. It's one of the most meaningful things I do. These are people who, often at the hardest moment of their lives, chose to contribute their clinical data and biospecimens to research. There’s so much meaning in getting to show them the impacts of their generosity.
A centerpiece of that newsletter is a Sankey diagram: a flow chart that traces each cancer type from consented patients, to the clinical data we collected, to the biospecimens we procured. It tells the whole story of contribution in a single image.
The status quo: a month of coordination
The first time I built that diagram, it took me 21 days. The work looked like this: download the raw data from OnCore, and clean it manually. Realize I had no way to actually generate the visualization. Track down a colleague who knew R Studio. Wait for time on their calendar. Sit through a tutorial. Write the code. Troubleshoot the code. And finally, weeks later, produce a single chart.
None of those steps were unreasonable on their own. But strung together, generating one image became a month-long project that depended on other people's availability and a programming environment I didn't know. For a task I needed to repeat every year, that wasn't sustainable.
This year: assign the task and receive the results
This year, I did the same thing in three minutes.
I uploaded the same OnCore export into Manifold as a custom dataset. I opened the AI Agent and typed one sentence:
"Please look at this dataset and create a Sankey diagram for me."
With the agent, building this chart took me 3 minutes.
That was it. The agent read the data and produced the visualization. When I wanted to adjust how the flows were grouped, I just described the change in plain language and the chart updated.
Alongside the chart, the agent returned the underlying code. That meant I could hand the output to our bioinformatics core and have it independently reviewed, which, in cancer research, is absolutely paramount.
The impact
The numbers tell the story plainly: 21 days became 3 minutes. A project that once required downloading, manual cleaning, a borrowed skill set, and rounds of back-and-forth now fits inside a coffee break.
But the part that matters the most is what the time saved makes possible. I'm no longer dependent on tracking down the one person who knows R or rationing a colleague's afternoon. I can iterate freely, try a different grouping, ask a follow-up question of my own data, and still meet my deadlines with room to spare. The barrier between having a question and seeing the answer has nearly disappeared.
Every minute I'm not wrestling with software is a minute I can spend on the work that actually matters: honoring the patients who made all of this research possible and telling them the story of what they helped build.
